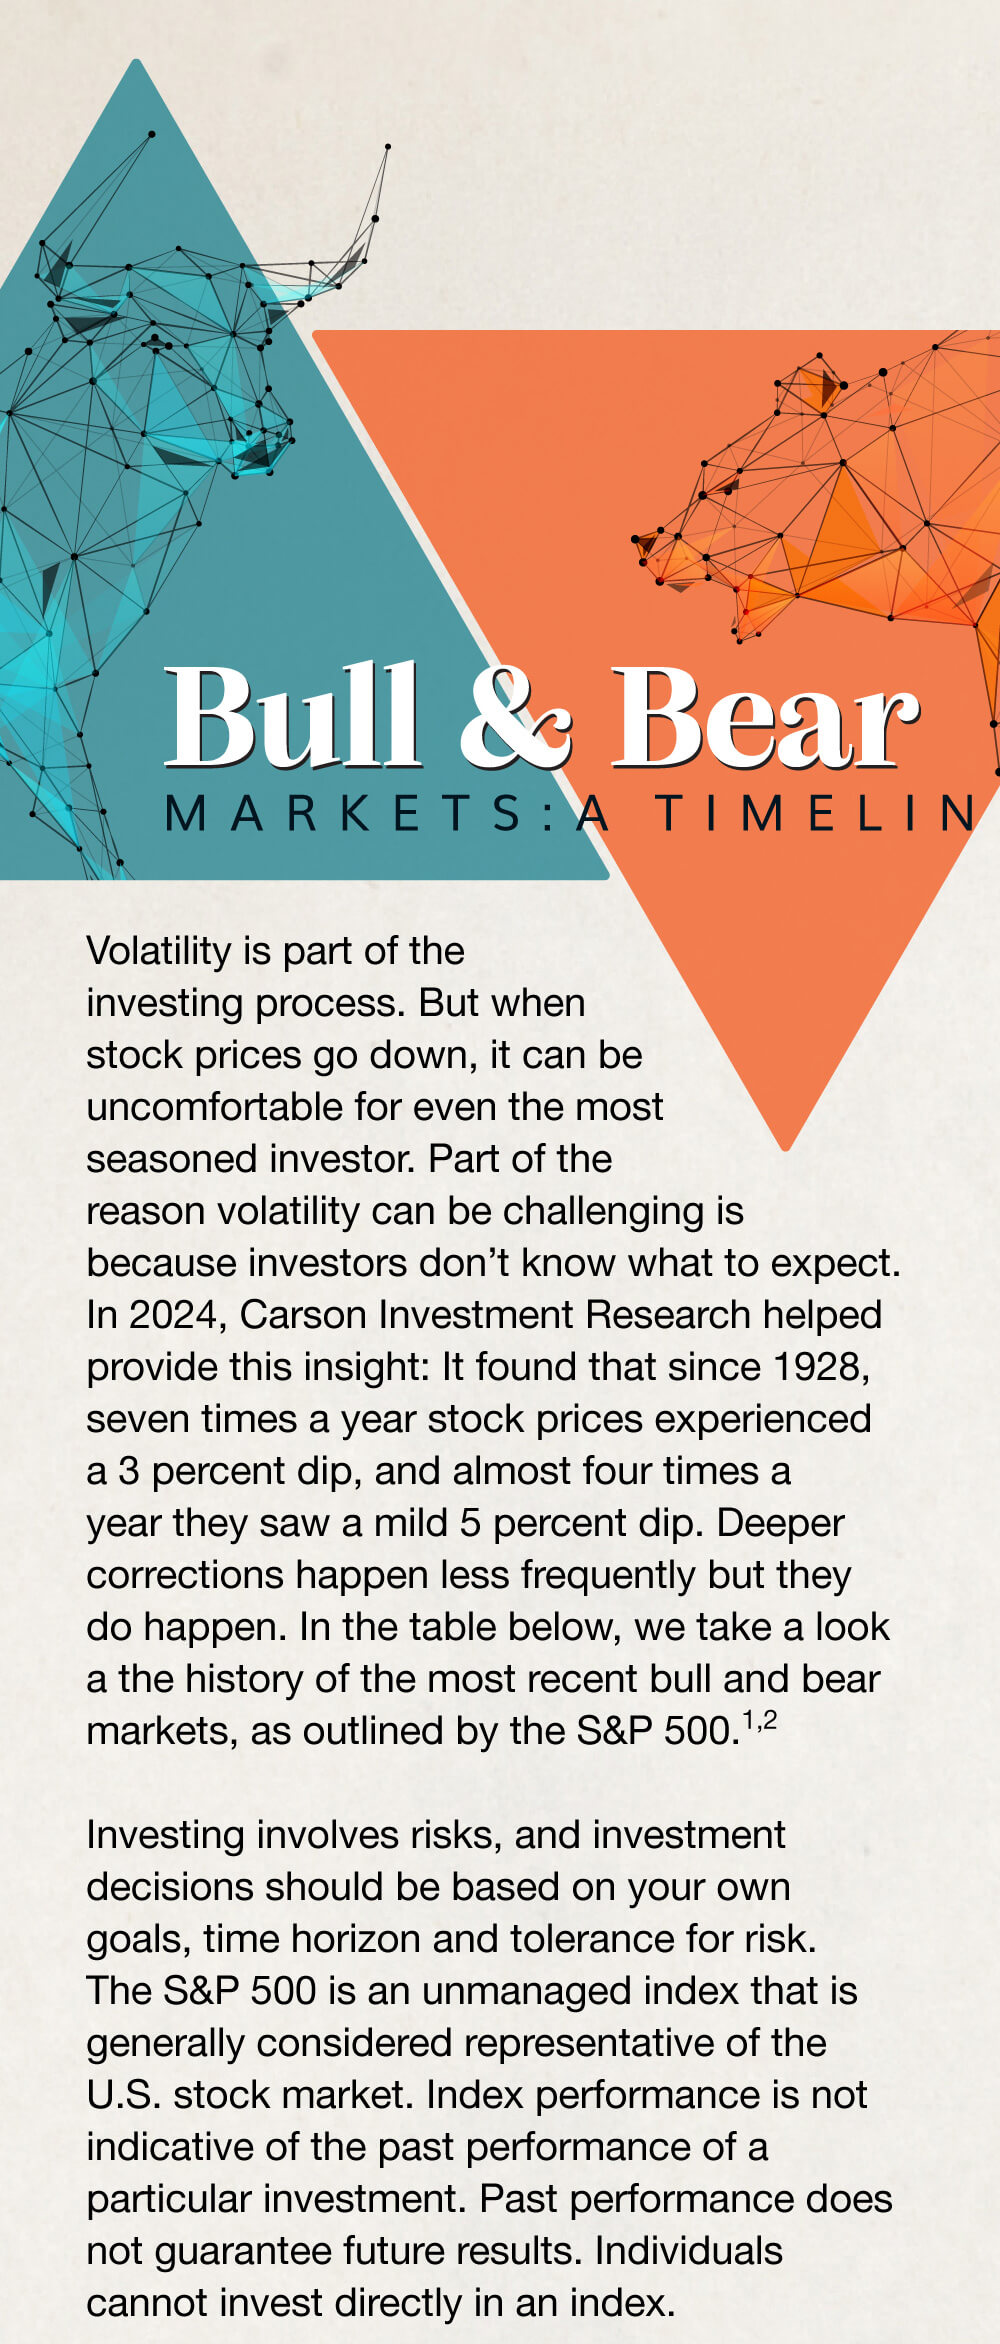
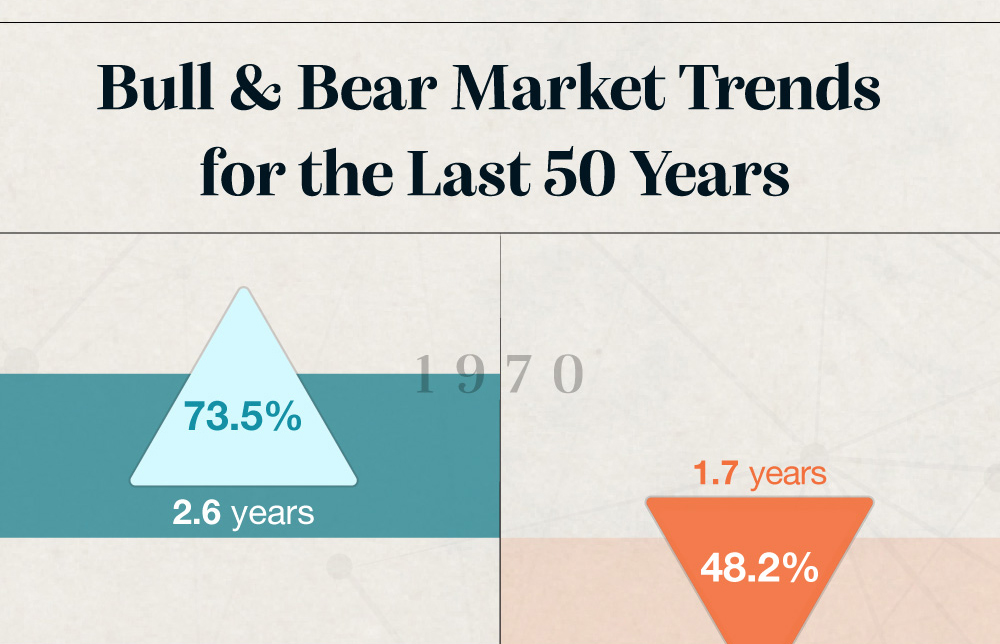
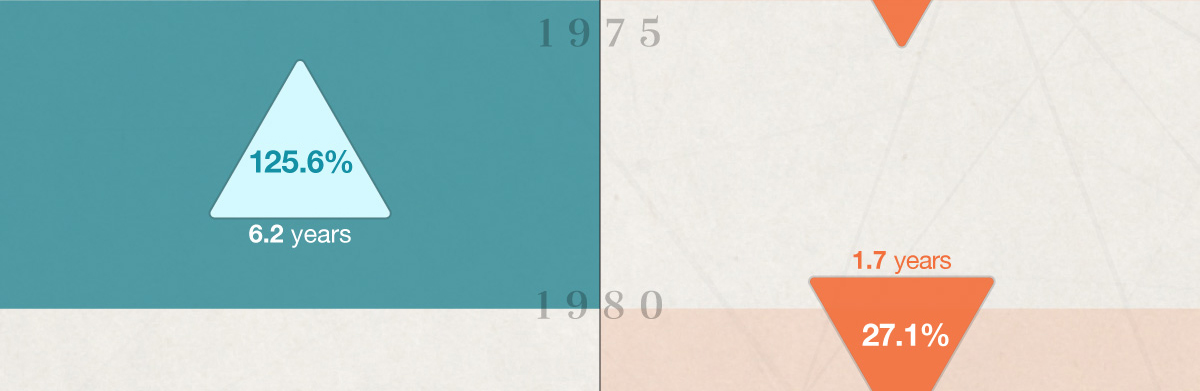
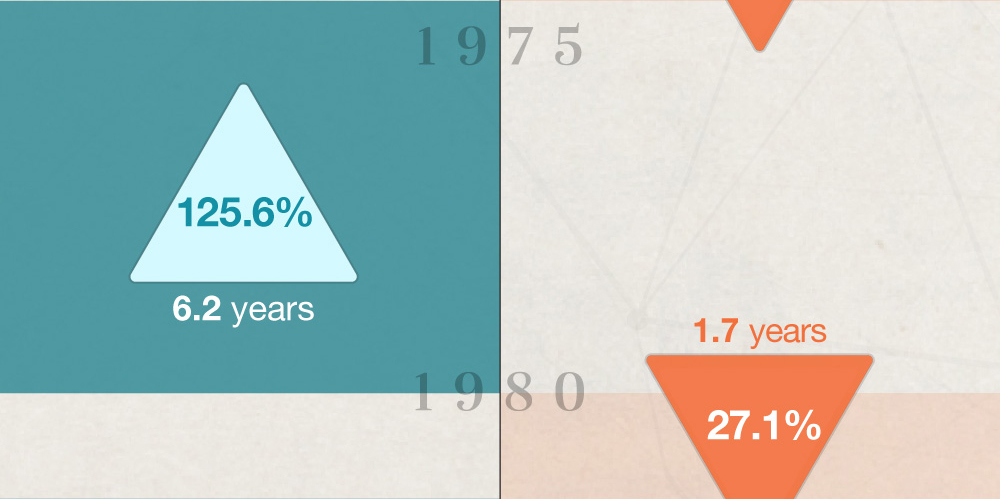
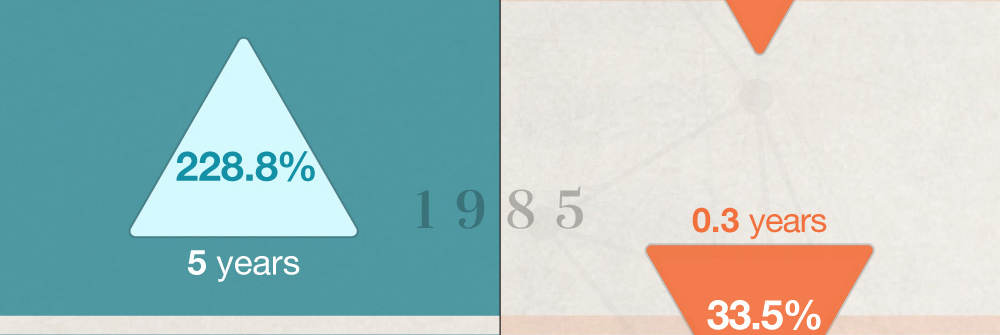
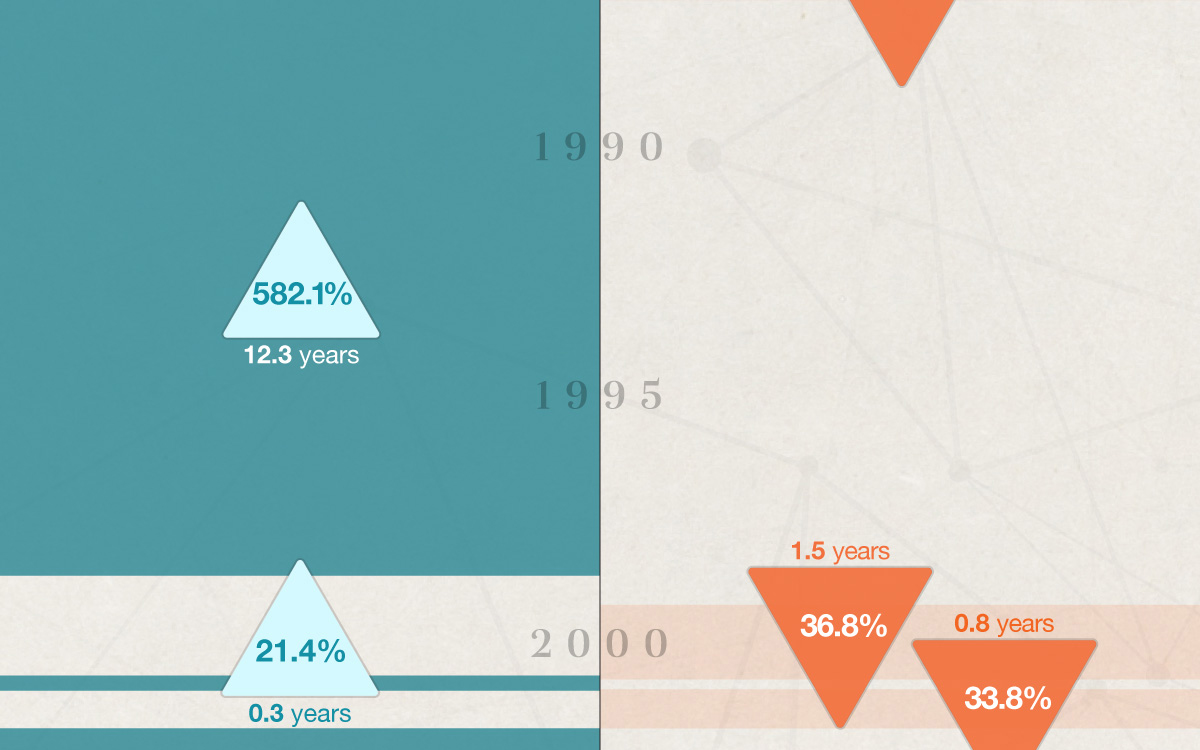
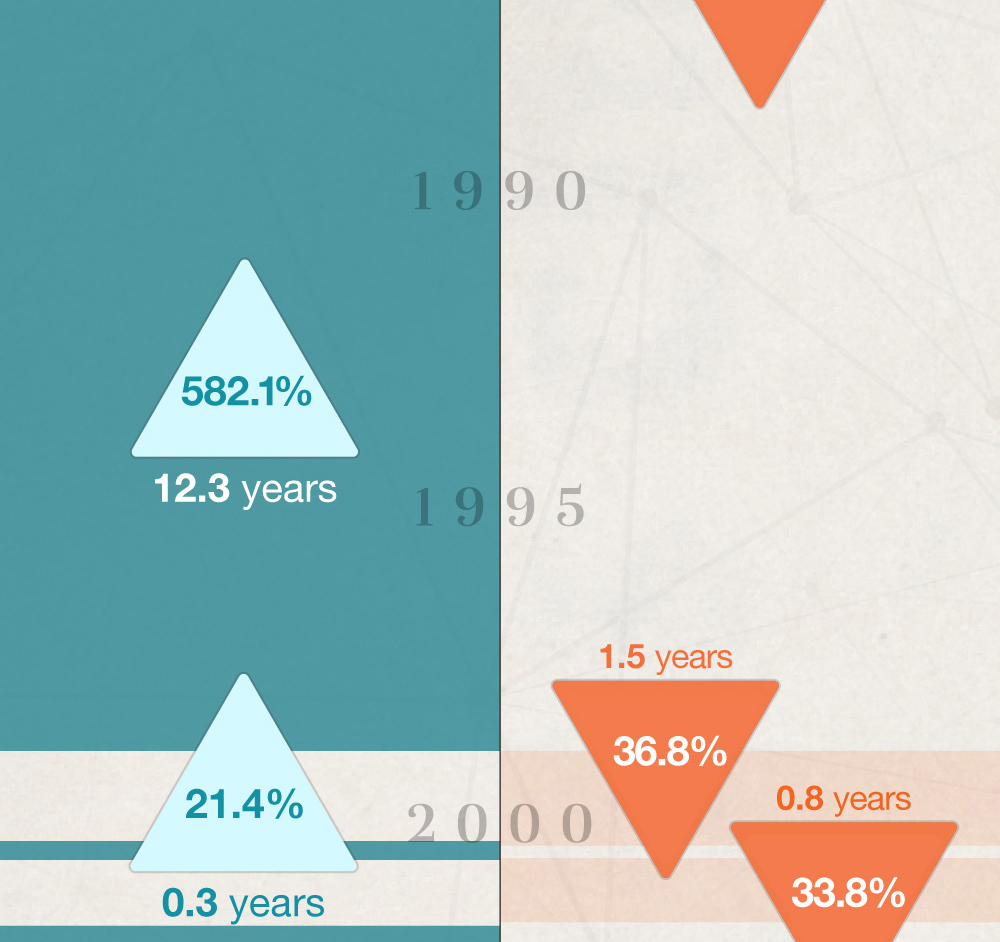
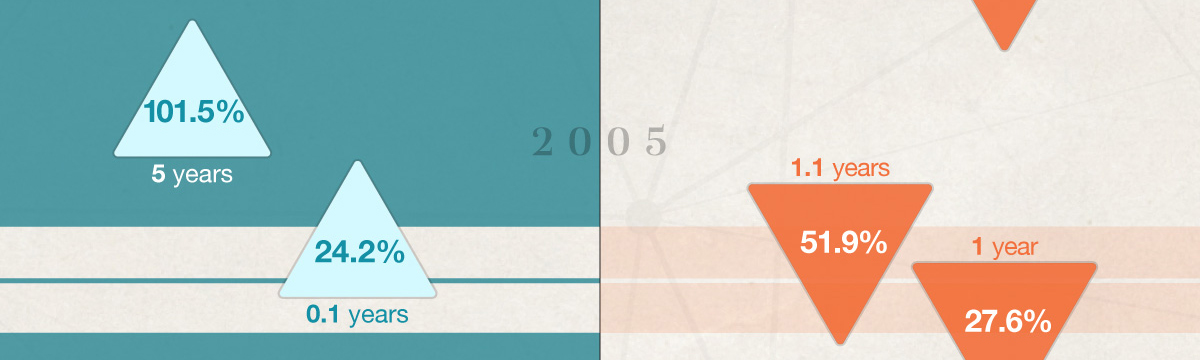
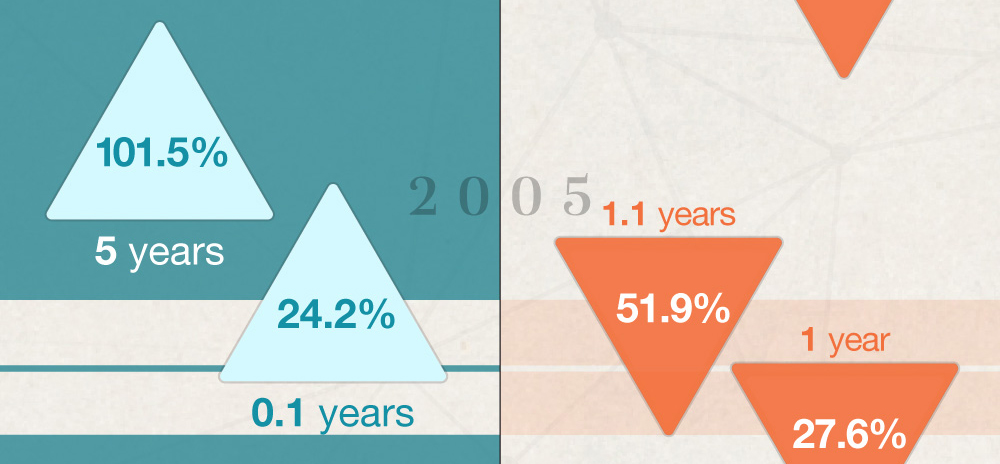
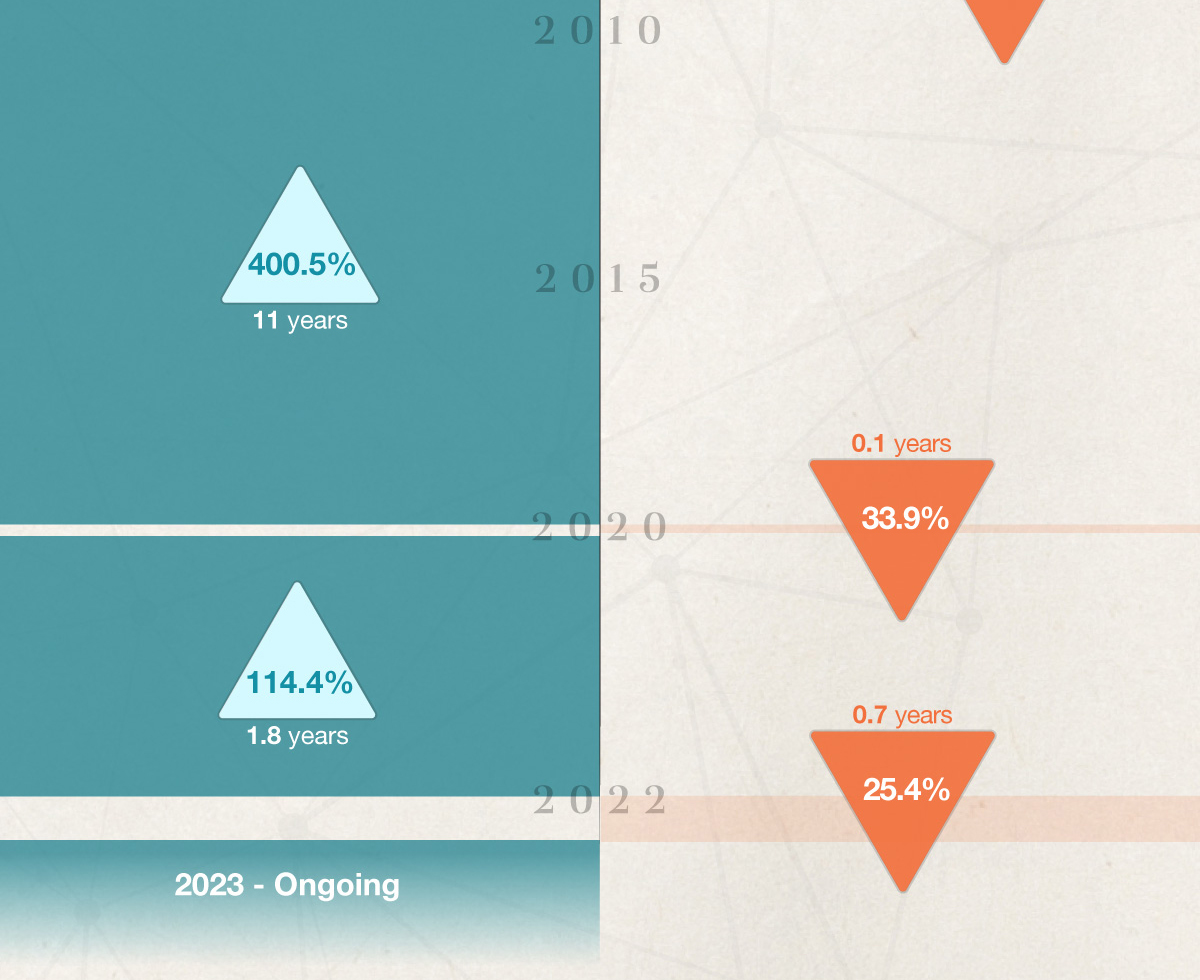
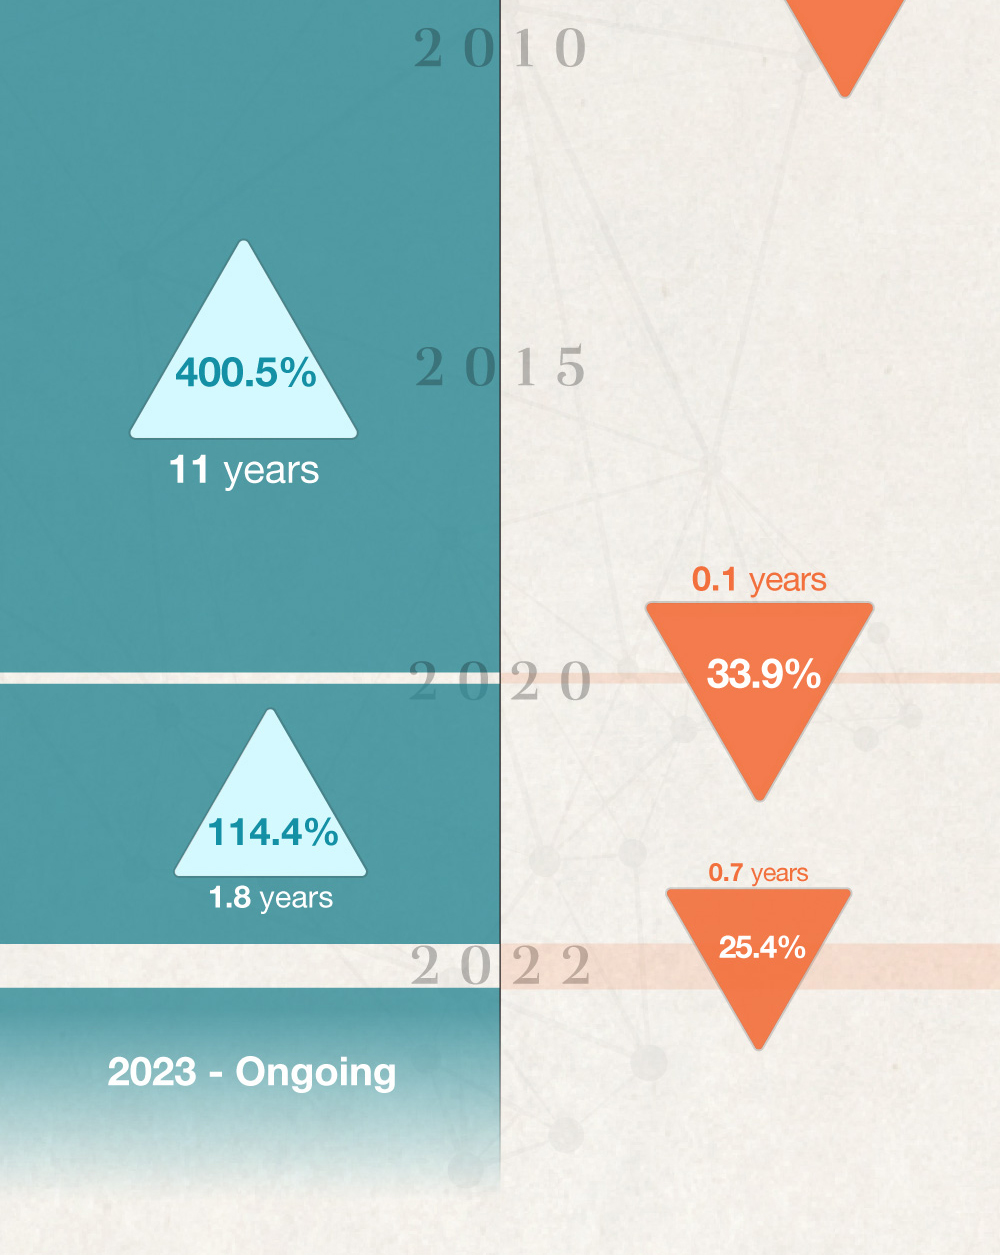
Bull & Bear Markets: A Timeline


This calculator estimates the savings from paying a mortgage bi-weekly instead of monthly.
Use this calculator to better see the potential impact of compound interest on an asset.
Lifestyle inflation can be the enemy of wealth building. What could happen if you invested instead of buying more stuff?
Learn about the benefits and requirements of opening a Roth IRA for kids.
This worksheet can help you estimate the costs of a four-year college program.
Most women don’t shy away from the day-to-day financial decisions, but some may be leaving their future to chance.
This questionnaire will help determine your tolerance for investment risk.
Enter various payment options and determine how long it may take to pay off a credit card.
Use this calculator to estimate your capital gains tax.
Pundits say a lot of things about the markets. Let's see if you can keep up.
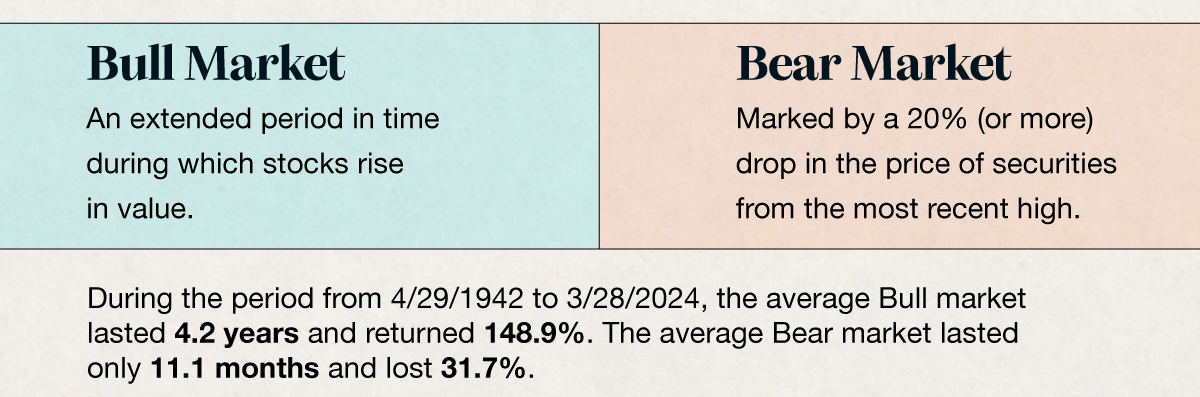
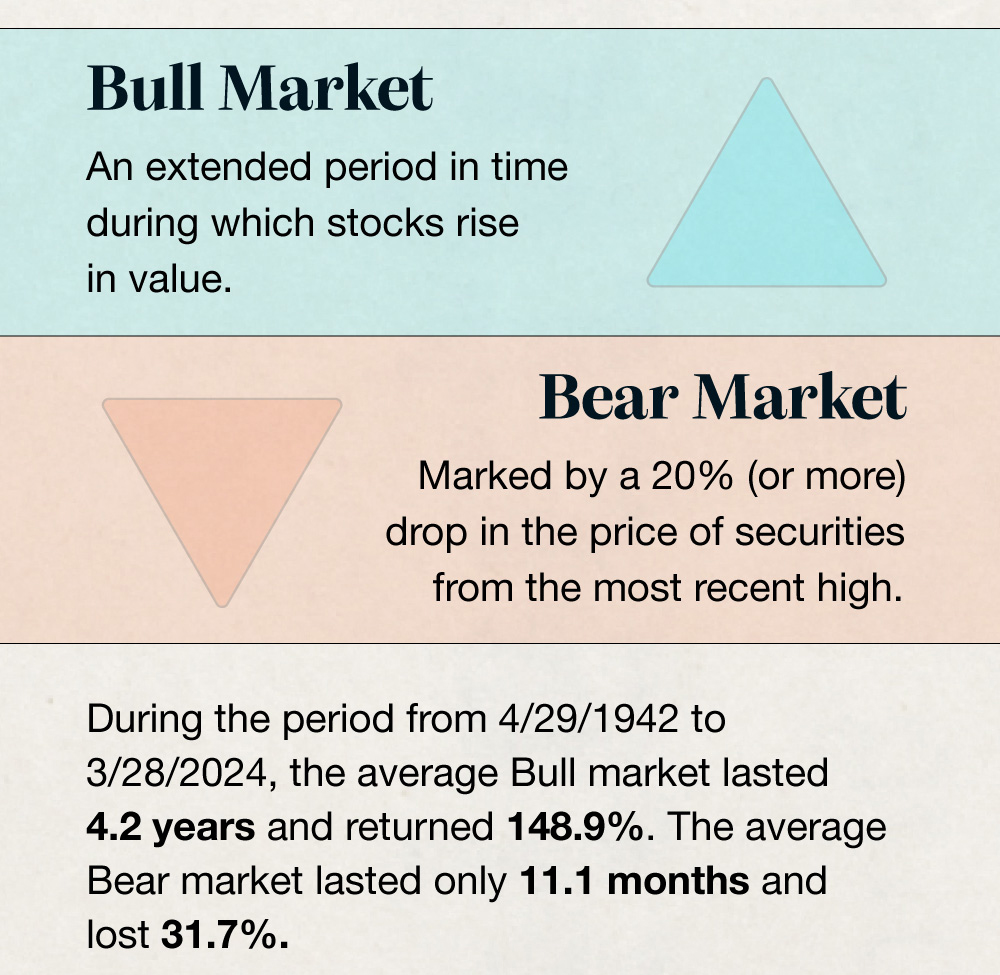
Learn about the difference between bulls and bears—markets, that is!
Reviewing coverage options is just one thing responsible pet parents can do to help look out for their dogs.